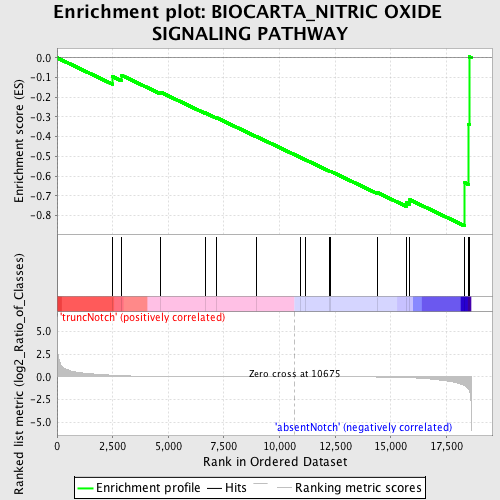
Profile of the Running ES Score & Positions of GeneSet Members on the Rank Ordered List
| Dataset | Set_03_absentNotch_versus_truncNotch.phenotype_absentNotch_versus_truncNotch.cls #truncNotch_versus_absentNotch |
| Phenotype | phenotype_absentNotch_versus_truncNotch.cls#truncNotch_versus_absentNotch |
| Upregulated in class | absentNotch |
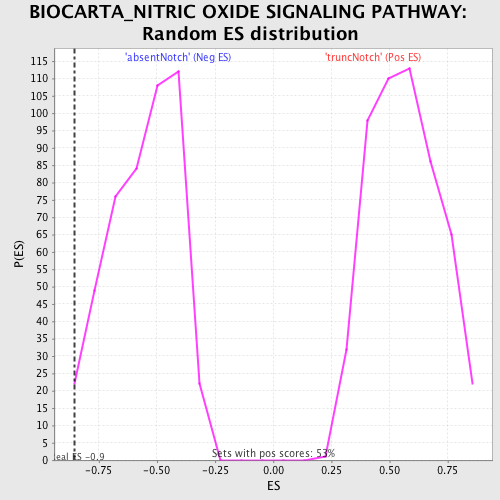
| GeneSet | BIOCARTA_NITRIC OXIDE SIGNALING PATHWAY |
| Enrichment Score (ES) | -0.8530228 |
| Normalized Enrichment Score (NES) | -1.5387905 |
| Nominal p-value | 0.01268499 |
| FDR q-value | 0.3283291 |
| FWER p-Value | 0.966 |
| PROBE | DESCRIPTION (from dataset) | GENE SYMBOL | GENE_TITLE | RANK IN GENE LIST | RANK METRIC SCORE | RUNNING ES | CORE ENRICHMENT | |
|---|---|---|---|---|---|---|---|---|
| 1 | PPP3CC | 2450139 | 2496 | 0.173 | -0.0953 | No | ||
| 2 | PRKCA | 6400551 | 2902 | 0.124 | -0.0891 | No | ||
| 3 | NOS1 | 5860129 | 4653 | 0.038 | -0.1746 | No | ||
| 4 | GRIN2A | 6550538 | 6659 | 0.014 | -0.2793 | No | ||
| 5 | GRIN2C | 1500538 | 7184 | 0.011 | -0.3050 | No | ||
| 6 | CAMK2B | 2760041 | 8972 | 0.004 | -0.4001 | No | ||
| 7 | GRIN2D | 6620372 | 10949 | -0.001 | -0.5062 | No | ||
| 8 | PPP3CA | 4760332 6760092 | 11156 | -0.001 | -0.5170 | No | ||
| 9 | PRKAR1B | 6130411 | 12265 | -0.005 | -0.5755 | No | ||
| 10 | GRIN2B | 3800333 | 12306 | -0.005 | -0.5766 | No | ||
| 11 | GRIN1 | 3800014 7000609 | 14398 | -0.023 | -0.6839 | No | ||
| 12 | PRKAR2B | 3130593 5220577 | 15697 | -0.087 | -0.7342 | Yes | ||
| 13 | PRKAR2A | 2340136 | 15854 | -0.100 | -0.7202 | Yes | ||
| 14 | PRKAR1A | 3450369 | 18326 | -0.974 | -0.6341 | Yes | ||
| 15 | PRKACB | 4210170 | 18485 | -1.364 | -0.3361 | Yes | ||
| 16 | PPP3CB | 6020156 | 18526 | -1.527 | 0.0048 | Yes |